|
Scroll down this page to see the effects of different insulin doses and regimens on the blood glucose profile of an example insulin-dependent diabetic patient.
|
|
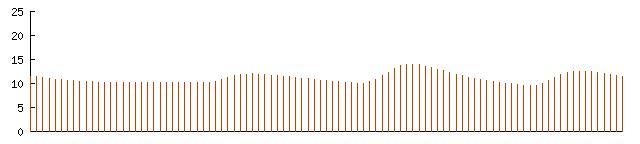
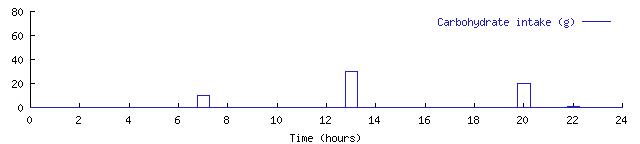
The first graph in the panel below shows a 24-hour blood glucose profile for a typical patient (in red). His carbohydrate intake is shown in grams on the second graph (in blue).
|
|
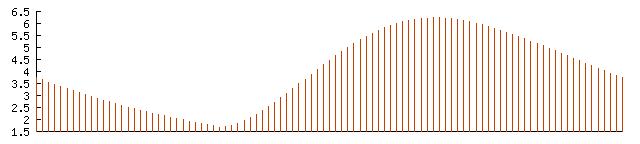
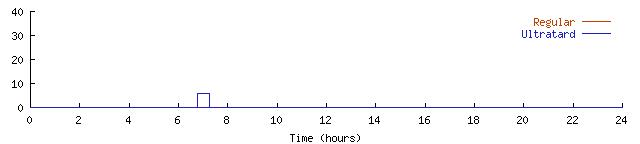
The next panel below shows the patient's simulated plasma insulin level on the upper graph (in red), and his insulin regimen of a once-daily Ultratard injection (in blue) on the lower graph.
|
|
This man is newly diagnosed with diabetes. He is still in the remission phase ('Honeymoon period') and therefore his body is effectively quite sensitive to the effects of insulin. As a result he only requires a single injection of a long-acting insulin preparation each day. Nevertheless his blood sugars are not that tightly controlled. How might he adjust his insulin regimen to improve his blood glucose profile?
|
|
Below is a data entry form showing this example patient's carbohydrate intake, insulin regimen, as well as other clinical variables such as weight and renal function. Try changing any of these fields to modify the regimen and click on the 'Run Simulation' button at the bottom of the page. This will result in the effects of the changes being displayed in your Web browser window.
|
|