|
Scroll down this page to see the effects of different insulin doses and regimens on the blood glucose profile of an example insulin-dependent diabetic patient.
|
|
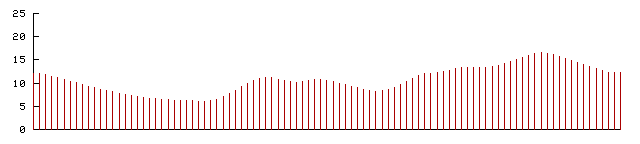
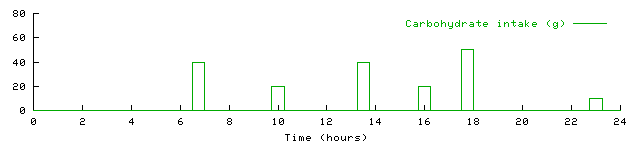
The first graph in the panel below shows a 24-hour blood glucose profile for a typical patient (in red). Her carbohydrate intake is shown in grams on the second graph (in green).
|
|
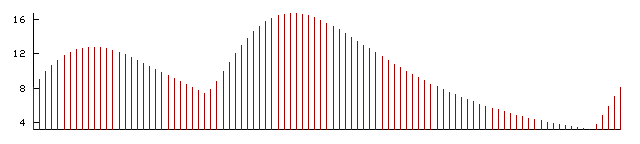
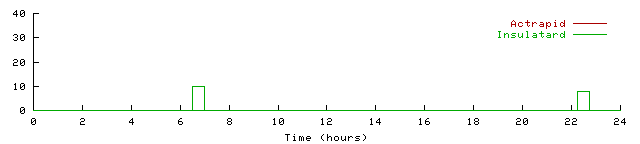
The next panel below shows the patient's simulated plasma insulin level on the upper graph (in red), and her insulin regimen of twice-daily intermediate acting insulin injections of Insulatard (in green) on the lower graph.
|
|
This young woman, who is very overweight, runs reasonably high blood sugars during the course of the day. At present she is only injecting herself twice daily with two 'shots' of intermediate-acting insulin. How might you add in a short-acting insulin preparation to her regimen to tighten her glycaemic contol?
|
|
Below is a data entry form showing this example patient's carbohydrate intake, insulin regimen, as well as other clinical variables such as weight and renal function. Try changing any of these fields to modify the regimen and click on the 'Run Simulation' button at the bottom of the page. This will result in the effects of the changes being displayed in your Web browser window.
|
|